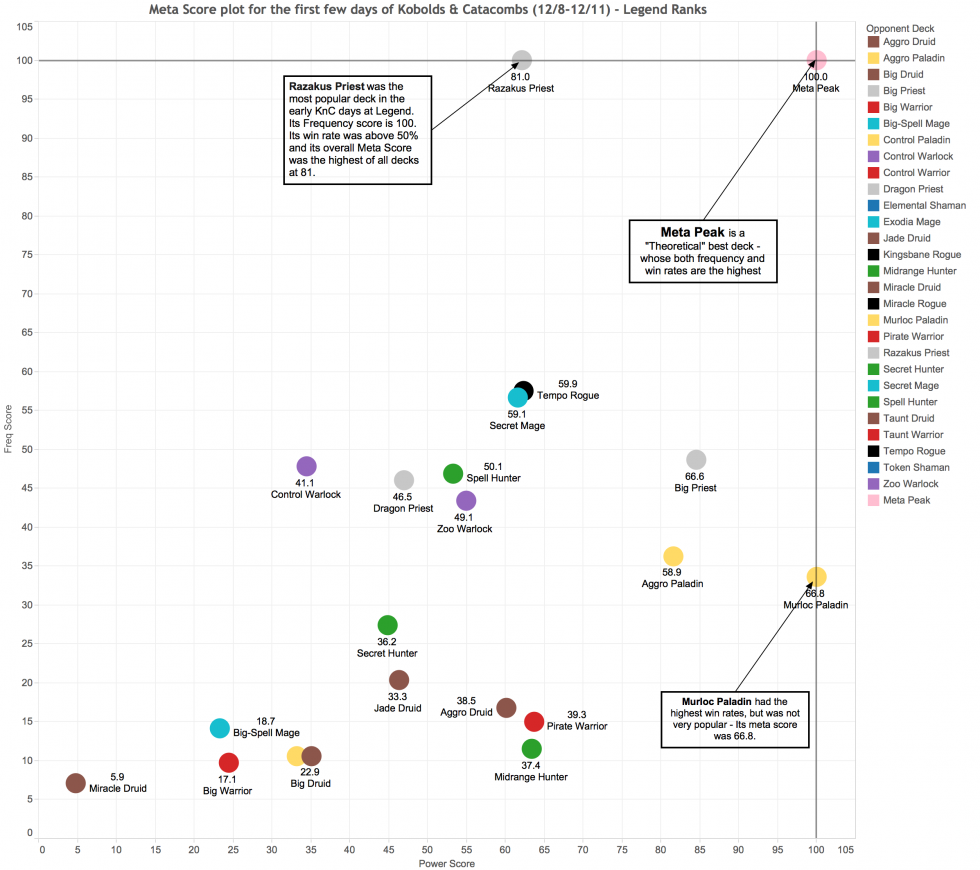
Frequent readers of the Data Reaper Report should know by now that an archetype’s strength in the meta is determined by two key factors: Win Rate and Prevalence. Neither of them is enough to evaluate how good a deck is.
Powerful decks will tend to be more popular. However, prevalence is often influenced by the perceived power of decks rather than their actual power, and sometimes there is a contradiction between them. Prevalence can also be determined by other factors that are not necessarily competitive (e.g., fun, cost of decks, speed of play). In addition, prevalence is not a good predictor of meta trends, but will usually be their end product.
A deck’s win rate is the most objective measure of its strength in the context of a meta and will often tell us whether it is likely to rise or decline in play. Powerful decks will tend to have higher win rates. However, win rate is also influenced by a deck’s popularity. As a deck gets more popular, it becomes the target for other strategies to beat. This meta-countering effect will tend to dampen a deck’s win rate. On the other hand, less popular decks tend to take advantage of a lack of hostility towards them, and sport a higher win rate than they would in “equilibrium.” Therefore, it is difficult to objectively compare two decks with a significant difference in prevalence and say which is “better”.
This is where the vS Meta Score comes in. It is a supplementary metric that measures each archetype’s relative standing in the meta, based on both win rate and prevalence, and in comparison to the theoretical “best deck”.
How is vS Meta Score calculated?
- We take the highest win rate recorded by a current archetype in a specific rank group, and set it to a fixed value of 100. We then determine the fixed value of 0 by deducting the highest win rate from 100%. For example, if the highest win rate recorded is 53%, a win rate of 47% will be set as the fixed value of 0. This is a deck’s Power Score. The range of 47% – 53%, whose power score ranges from 0 to 100, will contain “viable” decks. The length of this range will vary depending on the current state of the meta. Needless to say, it is possible for a deck to have a negative power score, but it can never have a power score that exceeds 100.
- We take the highest frequency recorded by a current archetype in a specific rank group, and set it to a fixed value of 100. The fixed value of 0 will then always be 0% popularity. This is a deck’s Frequency Score. A deck’s frequency score cannot be a negative number.
- We calculate the simple average of a deck’s Power Score and Frequency Score to find its vS Meta Score. The vS Meta Score is a deck’s relative distance to the hypothetical strongest deck in the game. Think of Power Score and Frequency Score as the coordinates (x, y) of a deck within a Scatter Plot. The Meta Score represents its relative placement in the plane between the fixed values of (0, 0) and (100,100).
- If a deck records both the highest popularity and the highest win rate, its Meta Score will be 100. It will be, undoubtedly, the best deck in the game.
Example of a vS Meta Score plane in the first week of the K&C meta, at legend ranks (preliminary results):

How does the vS Meta Score help us evaluate decks and the meta?
- The vS Meta Score allows us to rank decks along the two dimensions that determine their influence on the meta, and display these decks in one chart.
- This makes deck trends more visually appealing and easier for the reader, against the alternative of flipping between power rankings and frequency charts. By looking at the vS Meta Score plot, we can immediately understand the characteristics of a specific deck. For example, a deck carrying a relatively low power score and a high frequency score is likely to be targeted by the field.
- The vS Meta Score plot also allows us to evaluate the health of the meta. The presence of an oppressive deck will push all other archetypes towards (0,0), while a balanced meta will push multiple archetypes towards (100,100). How decks scatter within the plot tells us a lot about the state of the game.
- There are many more opportunities for the vS Meta Score to help us understand trends, which we will be discussing in future Data Reaper reports. We hope that this metric will help the community assess the meta more comprehensively, supplementing the vS Power Rankings.
See you in the coming report this week!
The Vicious Syndicate Team

great work as always! keep it up and on behalf of all f2p players out there, thank you!
I’d like to see a Meta Score chart from last expansion. It’s a bit hard to to evaluate the chart as a whole in the context of a new expansion without any other past examples for reference.
Normalized win rate vs. normalized frequency is a powerful visualization, and it will be great to see this presentation of the data moving forward.
I’m curious about your choice for normalizing win rates. Why did you choose 1-max(winrate) as the lower-bound for your power score rather than min(winrate)? One advantage of the latter is that the range would always be [0,1], whereas with your current method the lower bound is variable (i.e., [-x,1]). I’m sure you considered both, so I’m curious about what led you to your choice!
Great work in any case. You guys are an important force in the Hearthstone community, and I’m looking forward to seeing more of what you can do.
i think this would also be very useful within the data reaper live
i would recommend making it possible to click on a decks point on the graph and seeing a sample of what one of those decks would look like.
you also missed labeling Control Paladin on your chart next to big druid
Loved this new graph <3
If a deck’s popularity causes the meta to shift to target it, shouldn’t a high popularity decrease a deck’s score instead of increasing it? It would seem like a deck being popular would make it weaker BY being popular. Or is it about the reliability of the data?
If a popular deck is heavily targeted and STILL has a high win rate, it is probably the best deck in equilibrium. A deck with a higher win rate that is less popular may only have that rate because it is not as targeted.
Great addition! Could you add dashed lines at 50 / 50 to better “categorize” the decks into 4 quadrants? This basically splits them up into “High frequency (>=50) but low winrate ( < 50) " and the three other possibilites.
I´m a bit confused as to the difference between archetype and deck, when it comes to the Power Score. The plots shown in the graph, Are they archetypes or decks of a given archetype?
As far as I understood the averaged Power Score shown in the plot shows how close the average archetype player (for a given rank group) is to the highest winrate recorded (of a player in that rank group) for that archetype, which is assigned a 100.
Or could it mean how close the averaged winrate of all decks of a given archetype is to the winrate of the deck with the highest winrate in that archetype.
You could make a plot like this for decks, the example they give is for archetypes though, and I think their plan is just to use it for judging archetypes rather than deck lists.
Basically, what they’ve done is zoomed and scaled a portion of the %popularity/%win-rate graph: they’ve thrown away all the blank space, calling the highest win-rate archetype 100% power, and calling the most popular deck 100% “frequent”. Additionally, they’ve thrown away low-winrate decks…their chosen strategy is that decks that are losing by as much as the best decks are winning by are in the “competitive zone”, anything below that is considered not interesting (I think Patron Warrior may not have fallen within this “competitive zone” for the first month or three of its dominance, because it was so hard to pilot).
The meta score doesn’t really say anything about how good a deck is in the meta – you’d want one that gives higher scores to the underrepresented decks in the fourth quadrant, and lower scores to the overrepresented decks in the second quadrant, while this scores both regions equally, calling them just as strong in a vacuum, if the popular archetype wasn’t overrepresented and being teched against.
I think what meta score captures best is how much you should think about a given deck when you’re designing a new archetype or refining a decklist, and how much a given archetype is shaping the meta…you want to think more about the decks that are popular, discounting that if you can beat them even if you don’t because they are weak; likewise you’ll think about the decks that are strong, discounting that a bit if they are unpopular so you won’t face them much.
That makes much more sense. Thanks
Mmmm, delicious scatter plots. Great idea.
This looks very good. Are you keeping the popularity charts? I really enjoy seeing the relative popularity of a deck over time especially as the meta develops or balance changes are introduced.
Everything is kept. This is an additional interactive chart.
This is a data fanatic’s eye candy. Thanks for this!
You guys are going a fabulous work. thanks for everything!
YES! THIS IS AMAZING. Keep up the good work!