
Summer Preliminary Statistics of the Americas and European Championships
With the Summer Preliminary of the Western Hemisphere over, we’ve compiled statistics regarding these two major tournaments. In this article, we will present you with the following data (which can also be toggled between AM, EU and both):
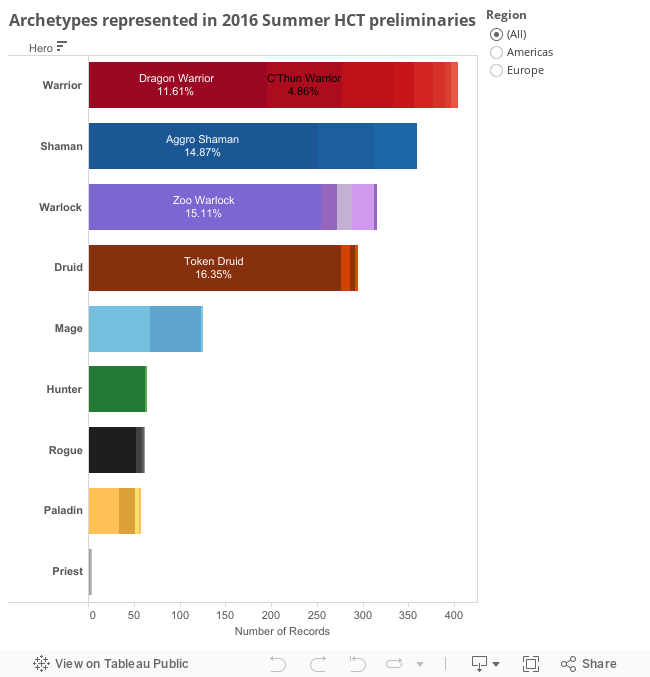
- Archetype Frequency
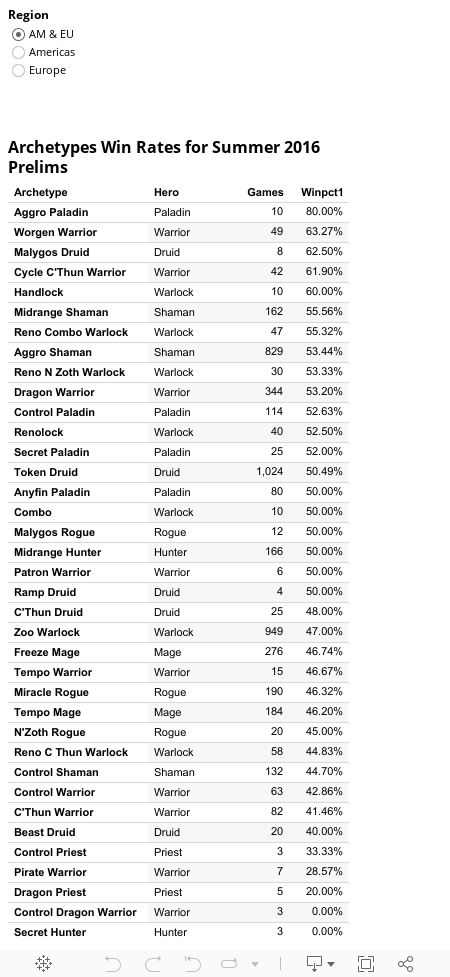
- Global Win Rates of Archetypes
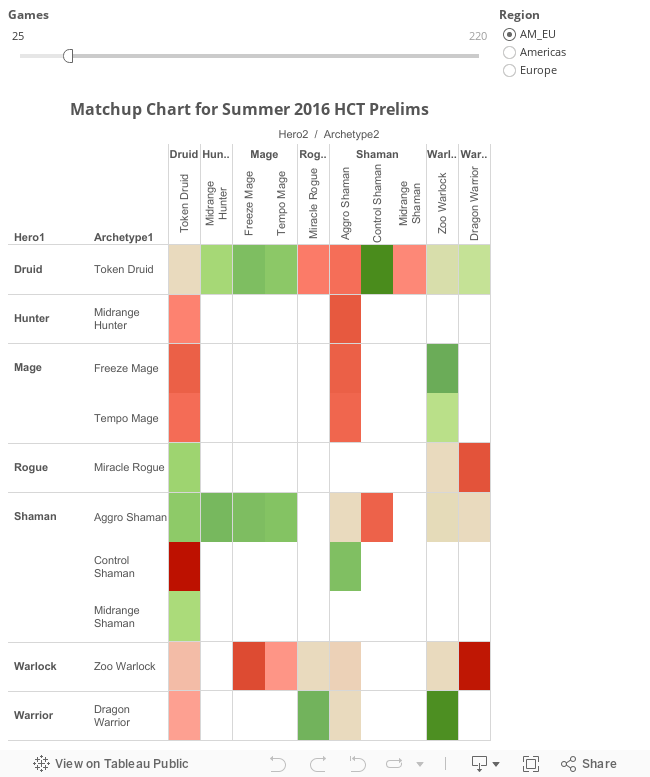
- Matchup Win Rates
NOTE 1: Global win rates are, of course, affected by players’ line ups. If a certain archetype was brought to counter a specific deck, and ended up playing many games against it, its win rate will be higher than what its power might be against the ladder Metagame. The ladder Metagame is very different due to changes in the dynamics in a format with bans and the limitation of one deck per class. Still, it is interesting and informative to see which archetypes ended up being successful in these tournaments and in the line-ups they were included in.
NOTE 2: Remain cautious when concluding anything from win rates of matchups with a low number of games. While we’ve set the minimum number of games to 25 (and it can be toggled based on your choices), the low numbers are likely to have extremely high variance (which can be seen as the value of ‘Stderr Win Rate’ when you hover over a box). What we’ve noticed is that every matchup with a high number of games (and a low error value) behaves very similarly to the statistics that we present on our ladder match up win rates charts. One potential outlier is Freeze Mage vs. Zoo, in which the Freeze Mage does significantly better at higher levels of play. Of course, that isn’t surprising to us.
Archetype Frequency: The Metagame Chart
Global Win Rates of Archetypes
Matchups Win Rates Matrix
This article was put together by:


Are mirror matches included in the global win rate? or excluded?
Ooooo! I love the content. Exactly what I needed for tournaments. Thank you!